Fluorescence Flow Cytometry: the next step in urine particle analysis
Fast and sensitive urine particle analysis: rely on thousands of particles counted and classified from native urine. Analysing native urine without centrifugation or pre-treatment avoids common sources of error and makes analysis even more standardised. In the following, we will walk you through the different steps that make up fluorescence flow cytometry.
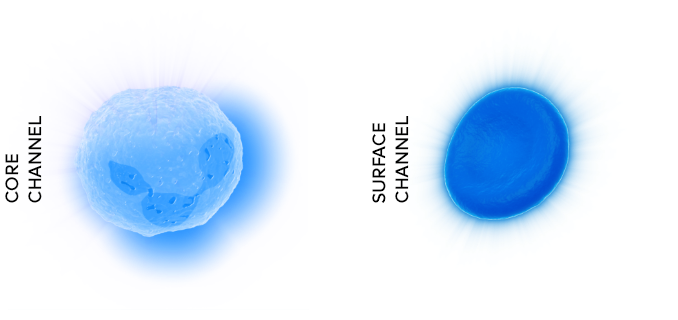
Step one: fluorescence staining
At the beginning of the flow cytometry measurement process, specific fluorochromes are used to label the core (DNA) and surface (membrane) structures of the particles in a sample. The fluorochromes are chosen based on their ability to emit fluorescent light when excited by a specific wavelength of light. This enables the characteristics of each particle to be identified and measured, allowing for a wider range of clinical parameters to be determined.
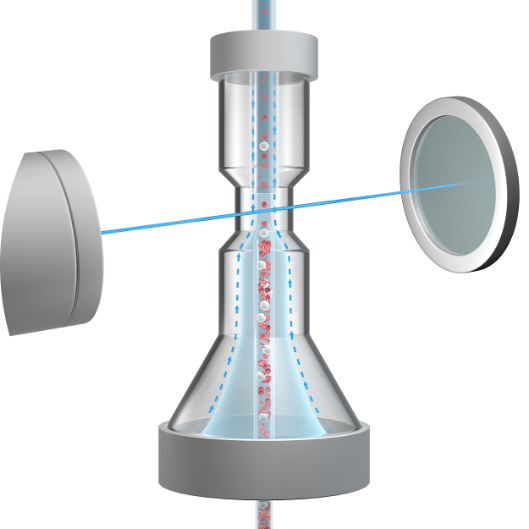
Step two: hydrodynamic focusing
A sheath reagent flow is used to separate and align the particles in the sample. The sheath reagent flow works by surrounding the sample with a fluid stream that directs the particles in a single file through the laser beam. This ensures that each particle is measured individually and accurately, leading to more precise results.
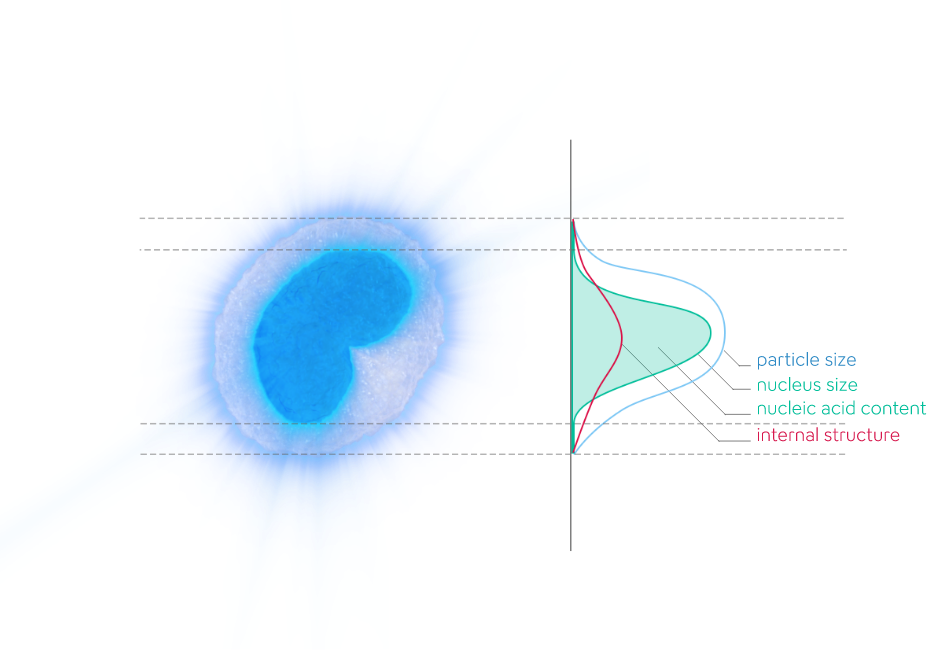
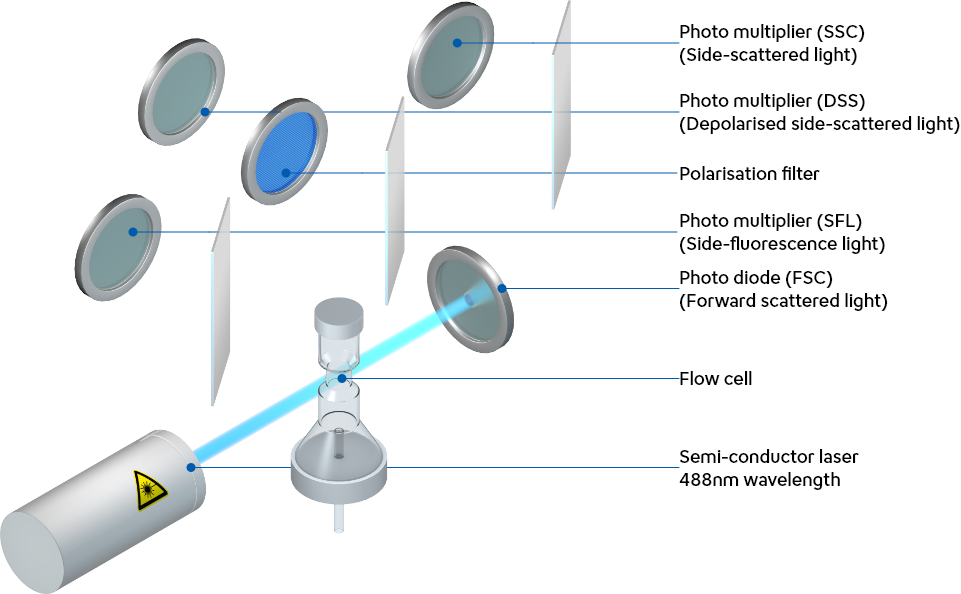
Step three: particle characterisation by laser scanning
Each particle passes through the 488nm-laser beam, which excites the individual particles and can separate the cells using four different signals. The signals collected by the detectors provide information on each particle's size, shape, depolarisation and fluorescence intensity. This level of detail and accuracy is what sets flow cytometry apart.
Step four: unique fingerprints
The detected light signal patterns are translated into individual 'fingerprints', which enable each particle to be identified and allocated to the relevant parameter. This leads to the quantification of each parameter, providing detailed information about the particles in the sample.
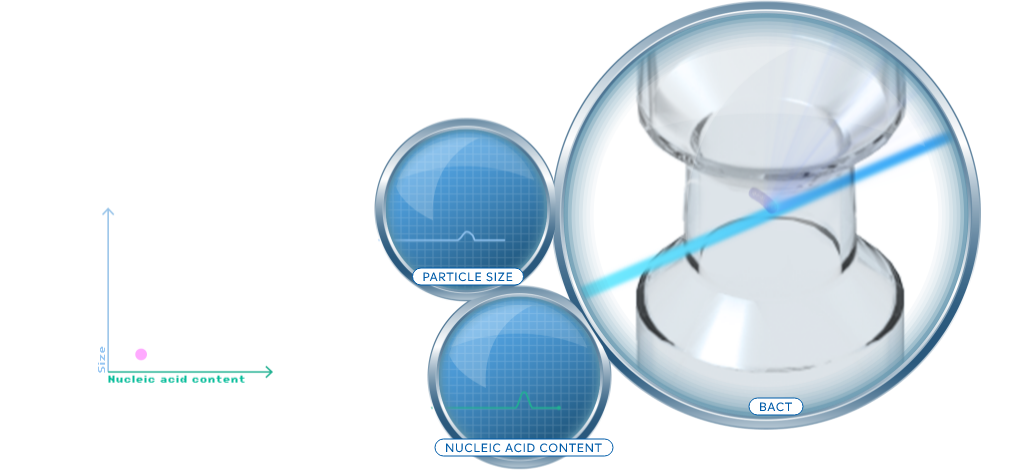
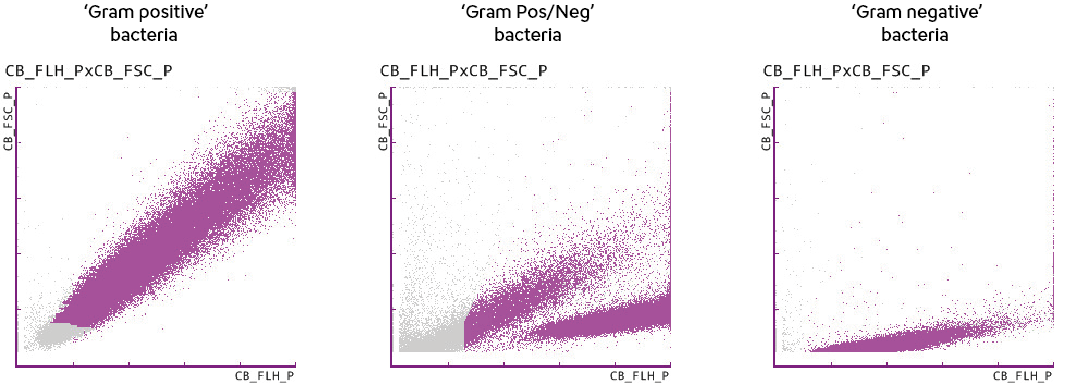
Step five: scattergram
Finally, the signals collected from one measurement are allocated to the corresponding parameters and summarised in scattergrams. Each scattergram represents the signals of one sample for one or more parameters, providing a comprehensive analysis of the particles and their characteristics. With fluorescent flow cytometry, large numbers of cells can be analysed in a short amount of time, providing detailed information about cell populations and their characteristics. This information can then be used to support clinical decision making.